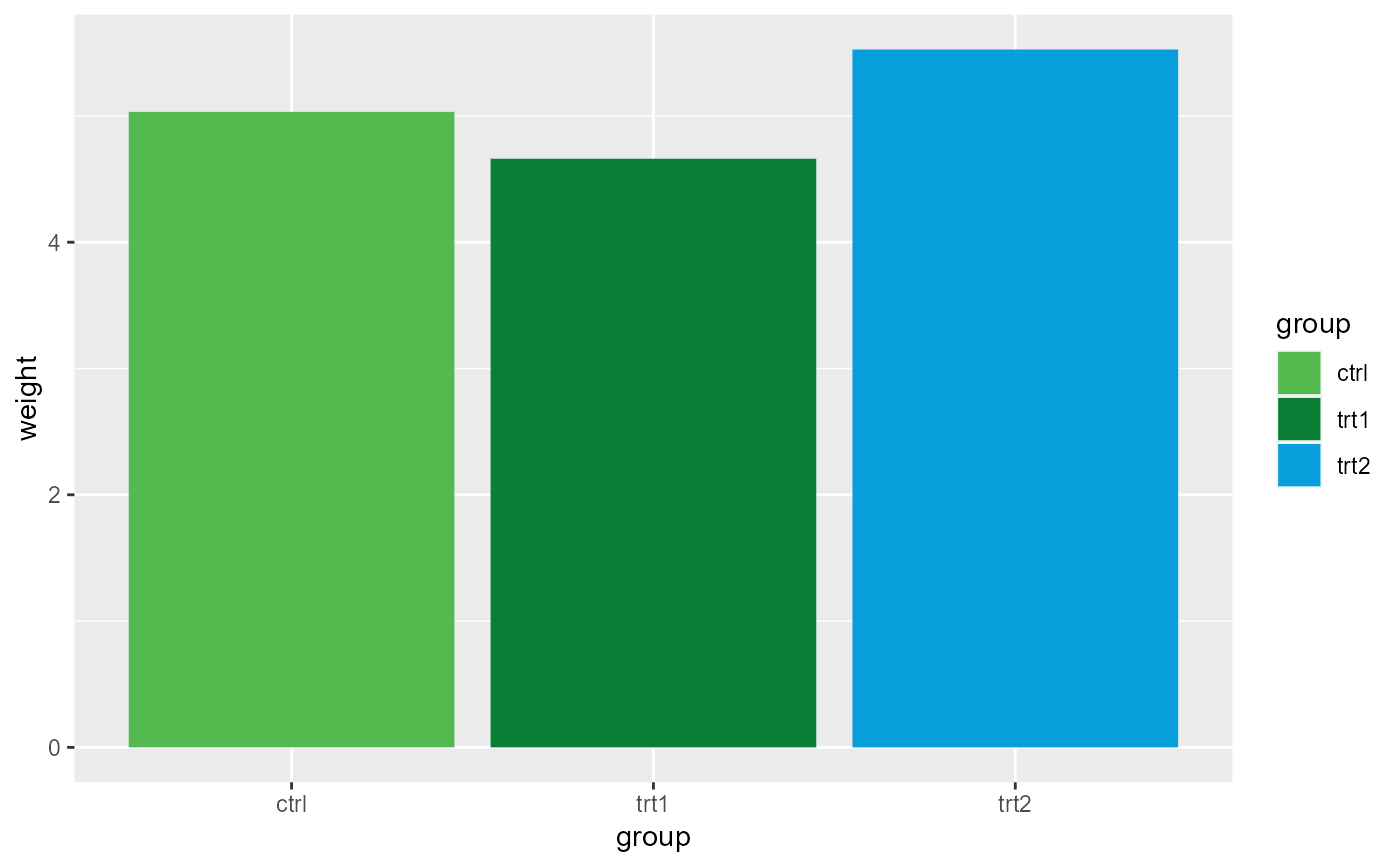
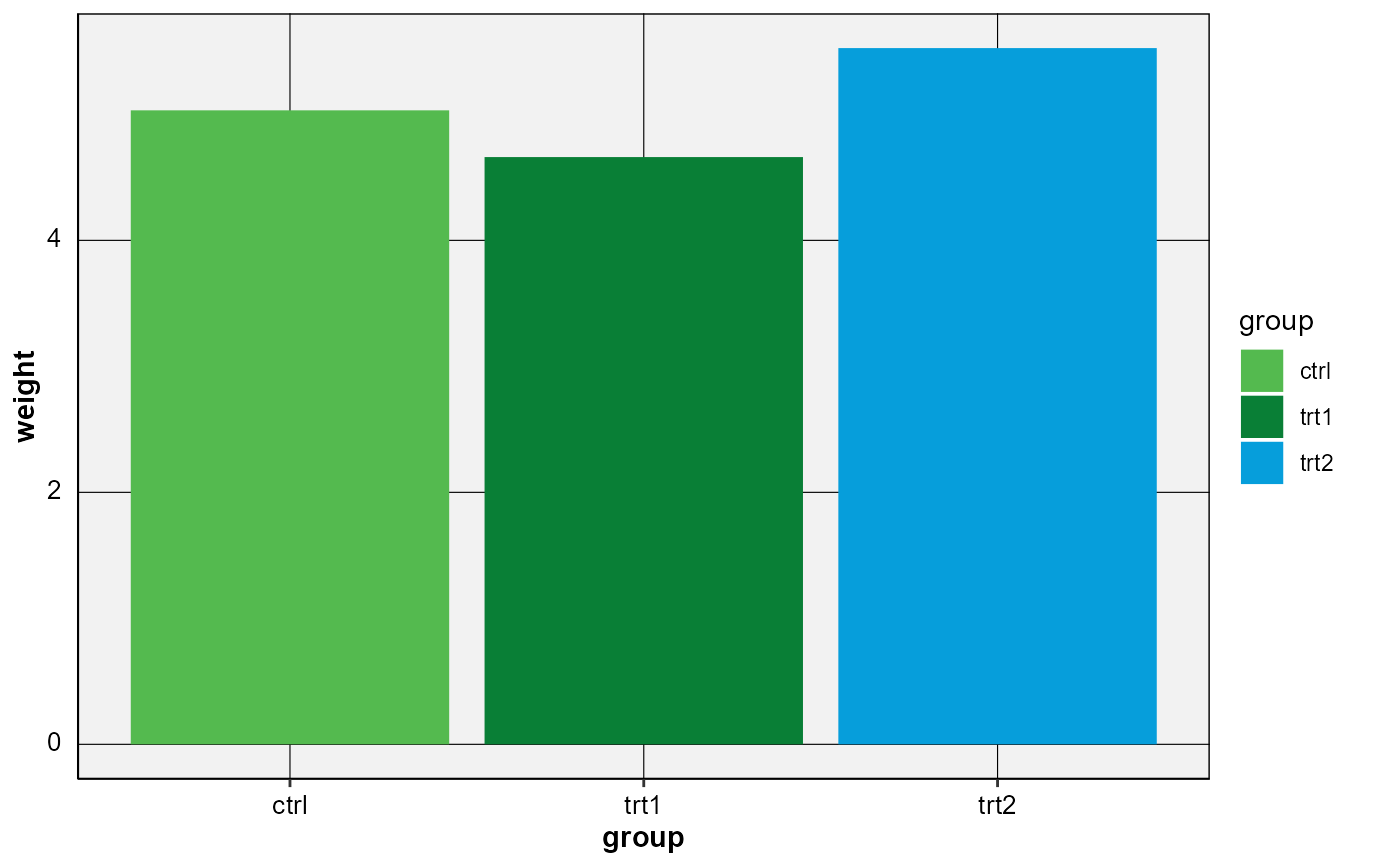
A ggplot2 theme based on the Umweltbundesamt corporate design.
theme_UBA.RdA ggplot2 theme based on the Umweltbundesamt corporate design.
theme_UBA(
  base_size = 11,
  base_family = "",
  base_color = "black",
  axis_title_bold = TRUE,
  axis_title_just = "cc",
  ticks = FALSE,
  grid_x = TRUE,
  grid_y = TRUE,
  grid_color = "black",
  grid_linetype = "solid",
  facette_distance = 1,
  facette_box = TRUE,
  facette_box_color = "black",
  title_size = 12,
  title_margin = margin(b = 10),
  subtitle_size = 9,
  subtitle_margin = margin(b = 10),
  axistext_size = 10,
  is_subplot = FALSE,
  legend_custom_bottom = FALSE
)
Arguments
- base_size
Base font size, given in pts.
- base_family
Base font family. Should be Calibri, but is not set as default.
- base_color
Base color for text and lines
- axis_title_bold
Should axis titles be bold?
- axis_title_just
Justification of axis titles.
rttranslates to "right" (x-axis) "top" (y-axis).- ticks
Should ticks be drawn on the axes?
- grid_x
Should there be major grid lines for the x-axis?
- grid_y
Should there be major grid lines for the y-axis?
- grid_color
Color of the grid lines
- grid_linetype
Linetype of the grid lines
- facette_distance
Distance between facettes
- facette_box
Should a rectangle be drawn around each facette?
- facette_box_color
Color of the rectangle around each facette
- title_size
Title font size, given in pts.
- title_margin
Margin around tile
- subtitle_size
Subtitle font size, given in pts.
- subtitle_margin
Margin around subtitle
- axistext_size
Axis text font size, given in pts.
- is_subplot
If
TRUE, font sizes and margins of title, subtitle and axis text are decreased. This is useful if multiple plots are to be combined.- legend_custom_bottom
If
TRUE, the legend is formatted in a specific way at the bottom of the plot
Examples
library(ggplot2)

p1 <- ggplot(data = PlantGrowth) +
  aes(y = weight, x = group, fill = group) +
  geom_bar(stat = "summary", fun = "mean")

BioMathR::palette_getset("UBA")
#>         gruen   dunkelgruen          blau    dunkelblau       flieder
#>     "#54ba4f"     "#097f36"     "#069edb"     "#015e85"     "#985ca6"
#> dunkelflieder       fuchsia dunkelfuchsia         ocker   dunkelocker
#>     "#5b2e67"     "#d12e69"     "#7e013e"     "#fdb912"     "#d68119"
#>      hellgrau    dunkelgrau
#>     "#d1d2d4"     "#4d4d4f"

p1


p1 + BioMathR::theme_UBA()
