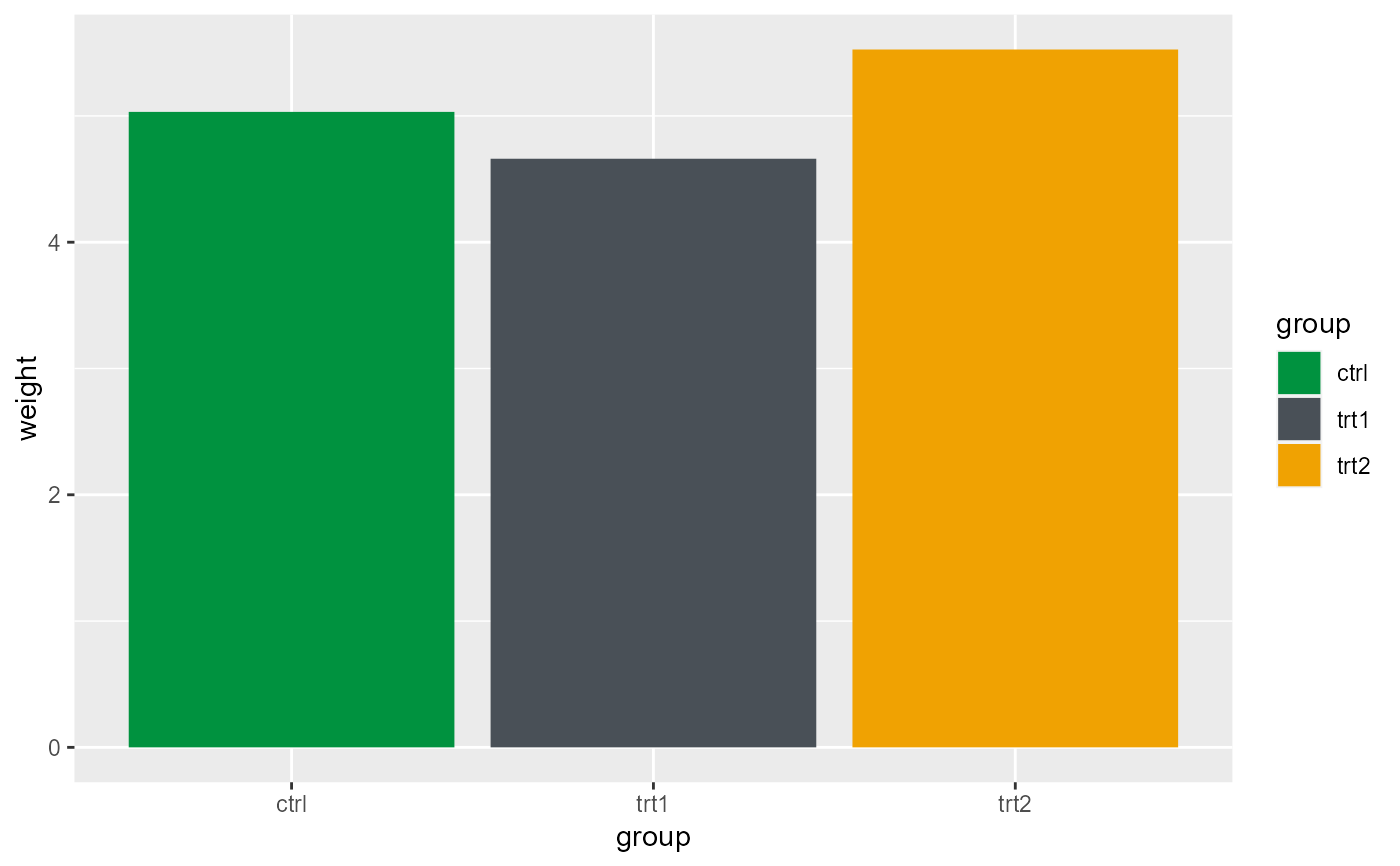
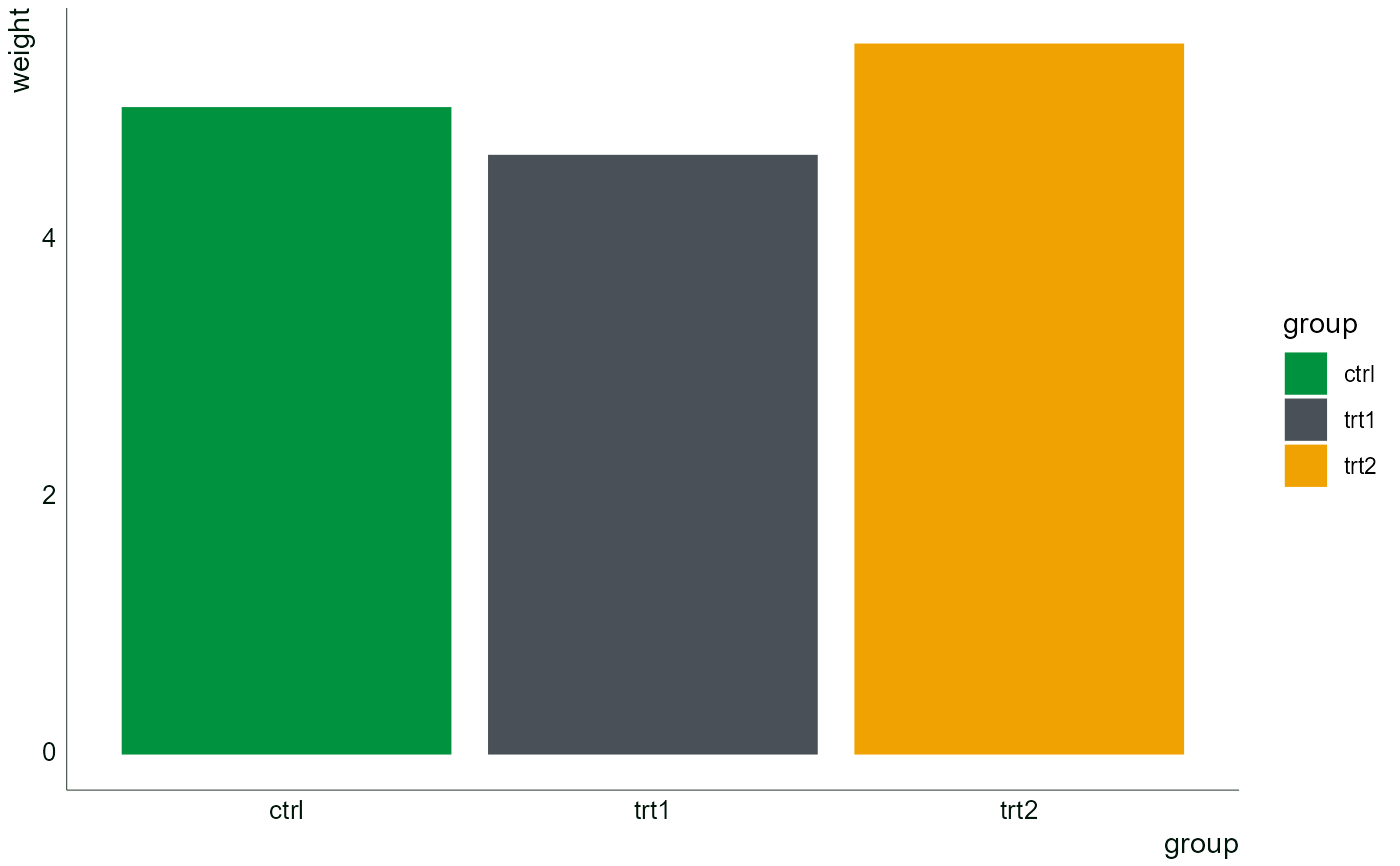
A ggplot2 theme based on the BioMath corporate design.
theme_BioMath.RdA ggplot2 theme based on the BioMath corporate design.
theme_BioMath(
  base_size = 11,
  base_family = "",
  base_color = "#001509",
  axis_title_bold = FALSE,
  axis_title_just = "rt",
  ticks = FALSE,
  grid_x = FALSE,
  grid_y = FALSE,
  grid_color = "#C0BCB5",
  grid_linetype = "dotted",
  facette_distance = 1,
  facette_box = FALSE,
  facette_box_color = "#C0BCB5",
  title_size = 14,
  subtitle_size = 10,
  axistext_size = 10,
  ggtext_axis = TRUE,
  whitebg = TRUE,
  ...
)
Arguments
- base_size
Base font size, given in pts.
- base_family
Base font family
- base_color
Base color for text and lines
- axis_title_bold
Should axis titles be bold?
- axis_title_just
Justification of axis titles.
rttranslates to "right" (x-axis) "top" (y-axis).- ticks
Should ticks be drawn on the axes?
- grid_x
Should there be major grid lines for the x-axis?
- grid_y
Should there be major grid lines for the y-axis?
- grid_color
Color of the grid lines
- grid_linetype
Linetype of the grid lines
- facette_distance
Distance between facettes
- facette_box
Should a rectangle be drawn around each facette?
- facette_box_color
Color of the rectangle around each facette
- title_size
Title font size, given in pts.
- subtitle_size
Subtitle font size, given in pts.
- axistext_size
Axis text font size, given in pts.
- ggtext_axis
If
FALSE, axis texts are rendered viaggplot2::element_text()instead ofggtext::element_markdown(). This can prevent potential rendering issues.- whitebg
If
TRUE, plot background is white, otherwise transparent.- ...
Other arguments passed to the underlying
ggplot2::theme_minimal()

