Wrapper function for desplot::desplot() across multiple columns
Source: R/desplot_across.R
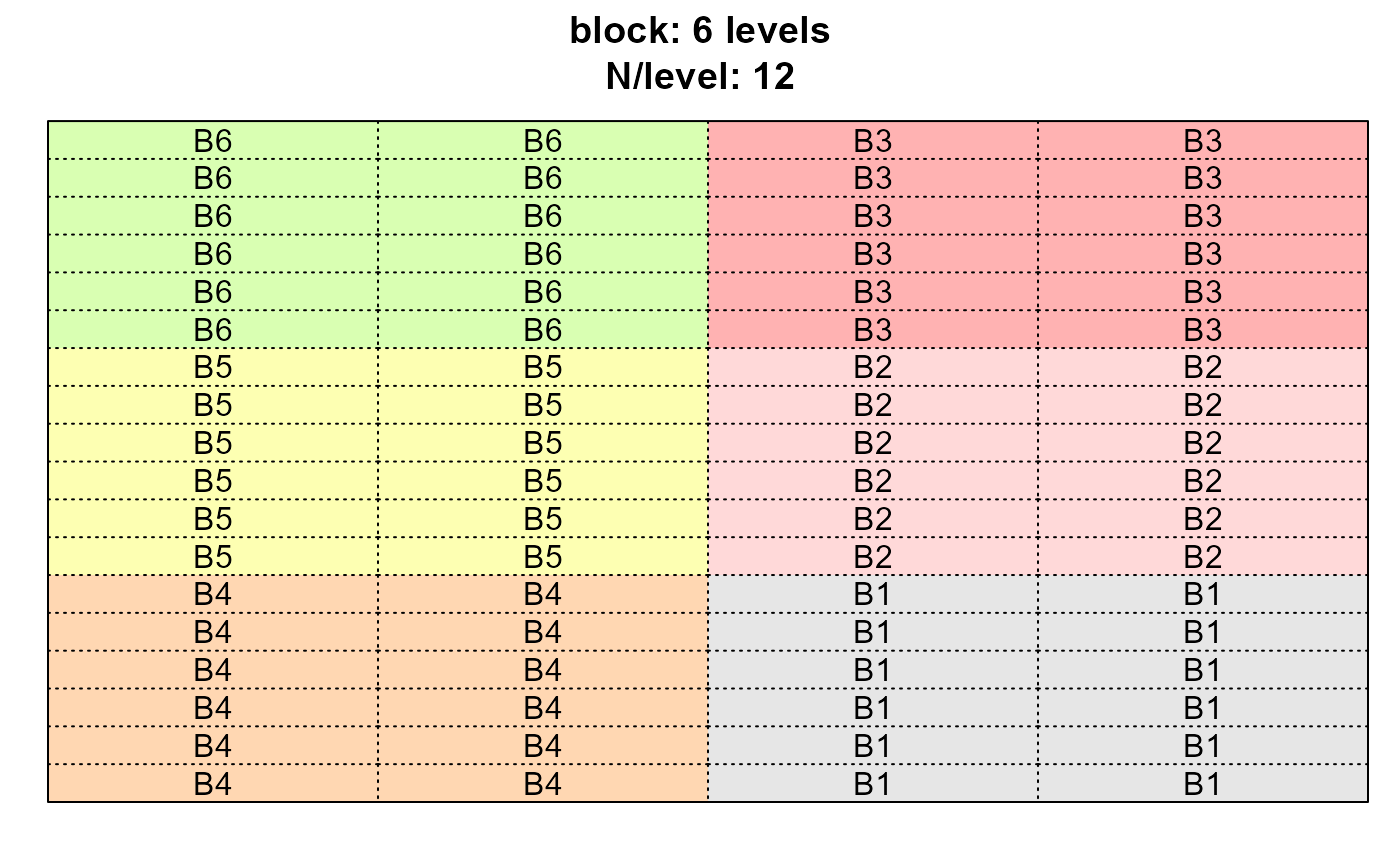
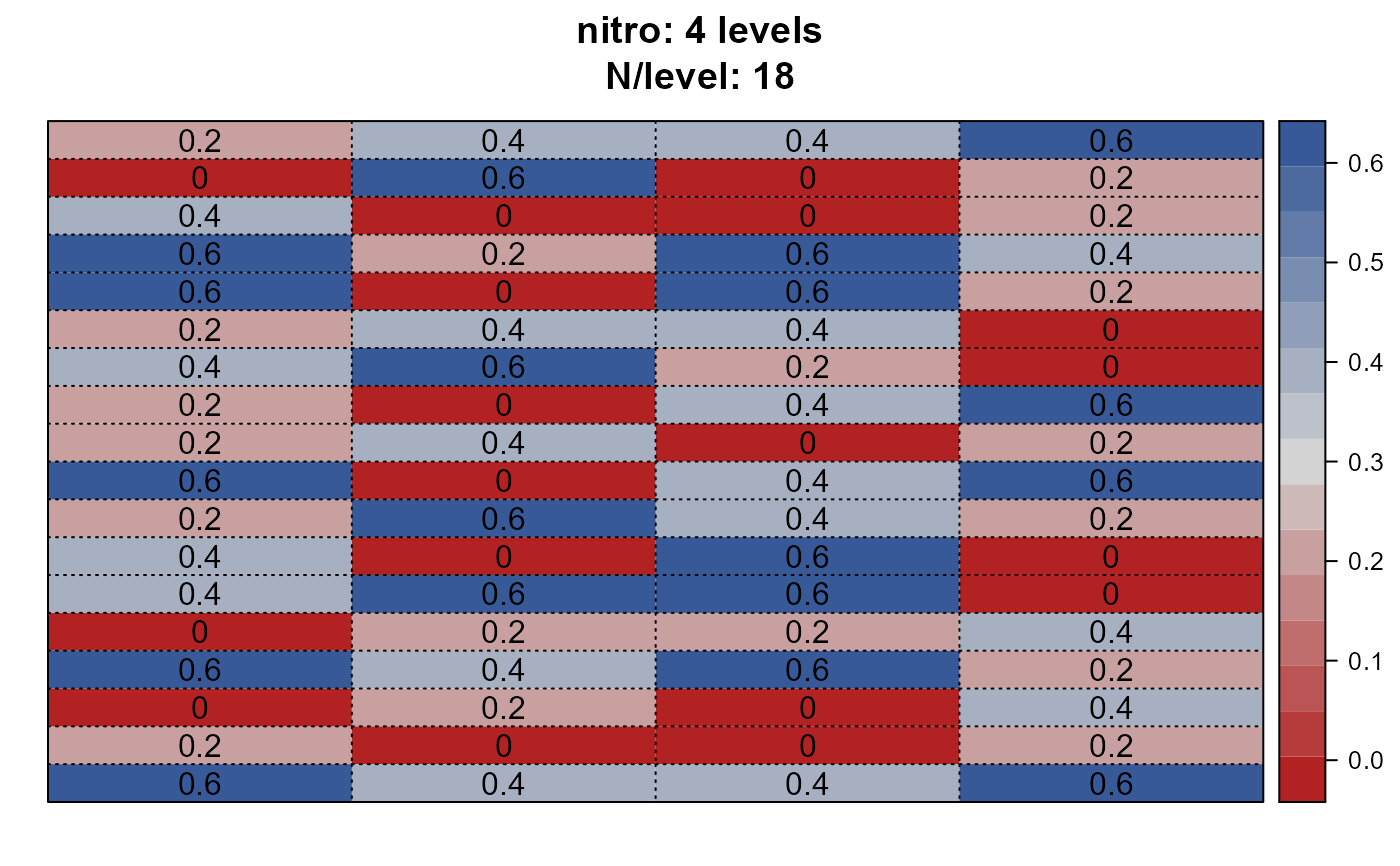
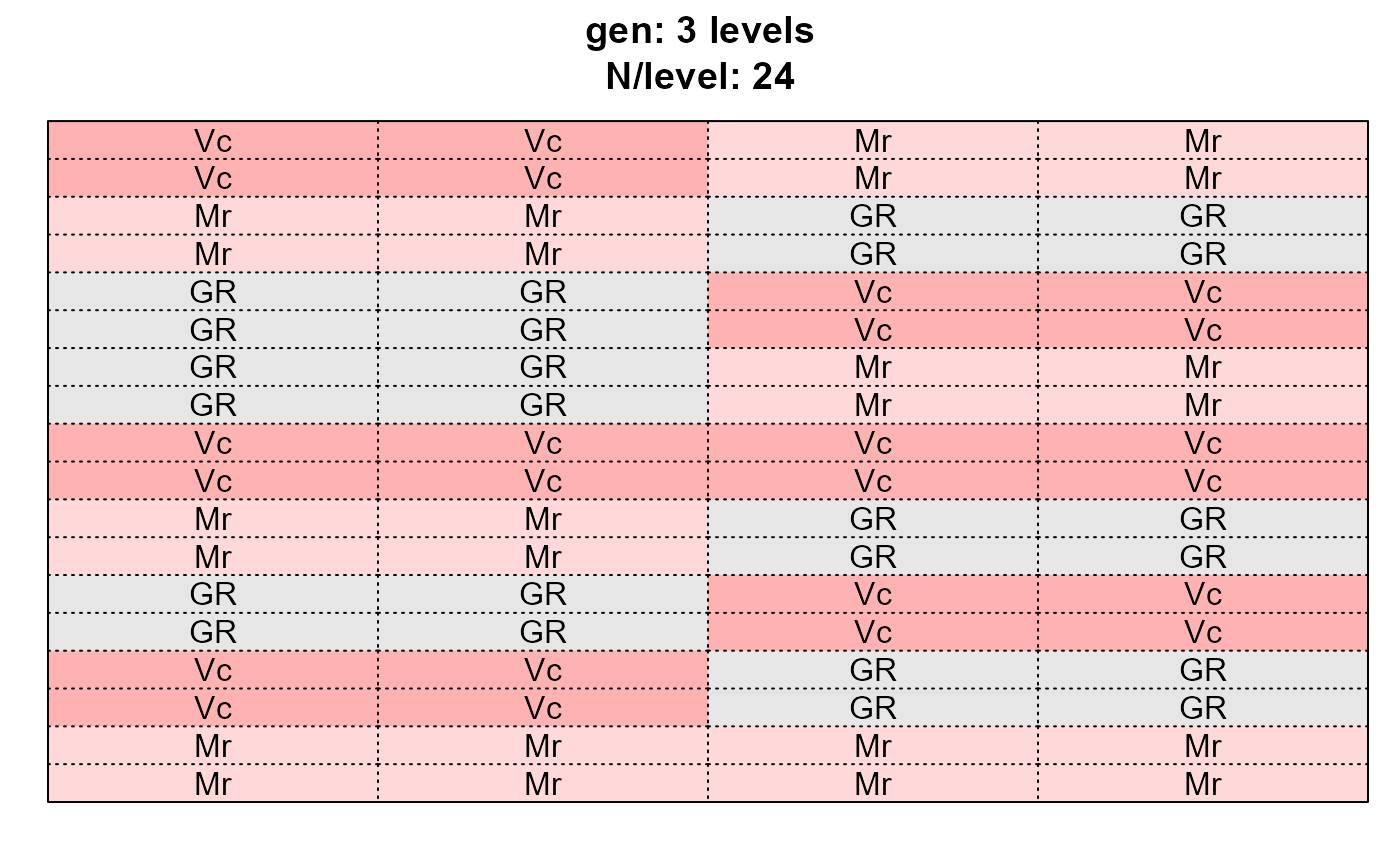
desplot_across.RdThe goal of this function is to allow the user a quick and easy glance at the experimental layout of a trial by creating multiple desplots at once - one for each variable that is provided (see example below).
Arguments
- data
A data frame.
- vars
<
tidy-select> Variables/column names for which a desplot should be created. You can use tidyselect helpers likestarts_with(),ends_with(),contains(), etc.- formright
A formula like
x*y|location, i.e. the right-hand side of the formulayield~x*y|locationthat would usually be passed todesplot::desplot(form = ...). Note thatxandyare numeric and the default is"col + row".- lang
Language for plots labels.
- title
Can either be
"none","short"or"long". For the respectivevar, it gives information about the number of levels and their respective frequency in the data.- flip
see
desplot::desplot()documentation - set to opinionated default here- out1.gpar
see
desplot::desplot()documentation - set to opinionated default here- out2.gpar
see
desplot::desplot()documentation - set to opinionated default here- ...
Other arguments passed to
desplot::desplot().
Value
A list of desplots.
Examples
library(BioMathR)

# Using explicit column names
dps <- desplot_across(data = agridat::yates.oats,
                      vars = c("nitro", "gen", "block"),
                      cex = 1)

# Using tidyselect helpers
dps2 <- desplot_across(data = agridat::yates.oats,
                       vars = starts_with("n"),
                       cex = 1)

dps$nitro

dps$gen

dps$block